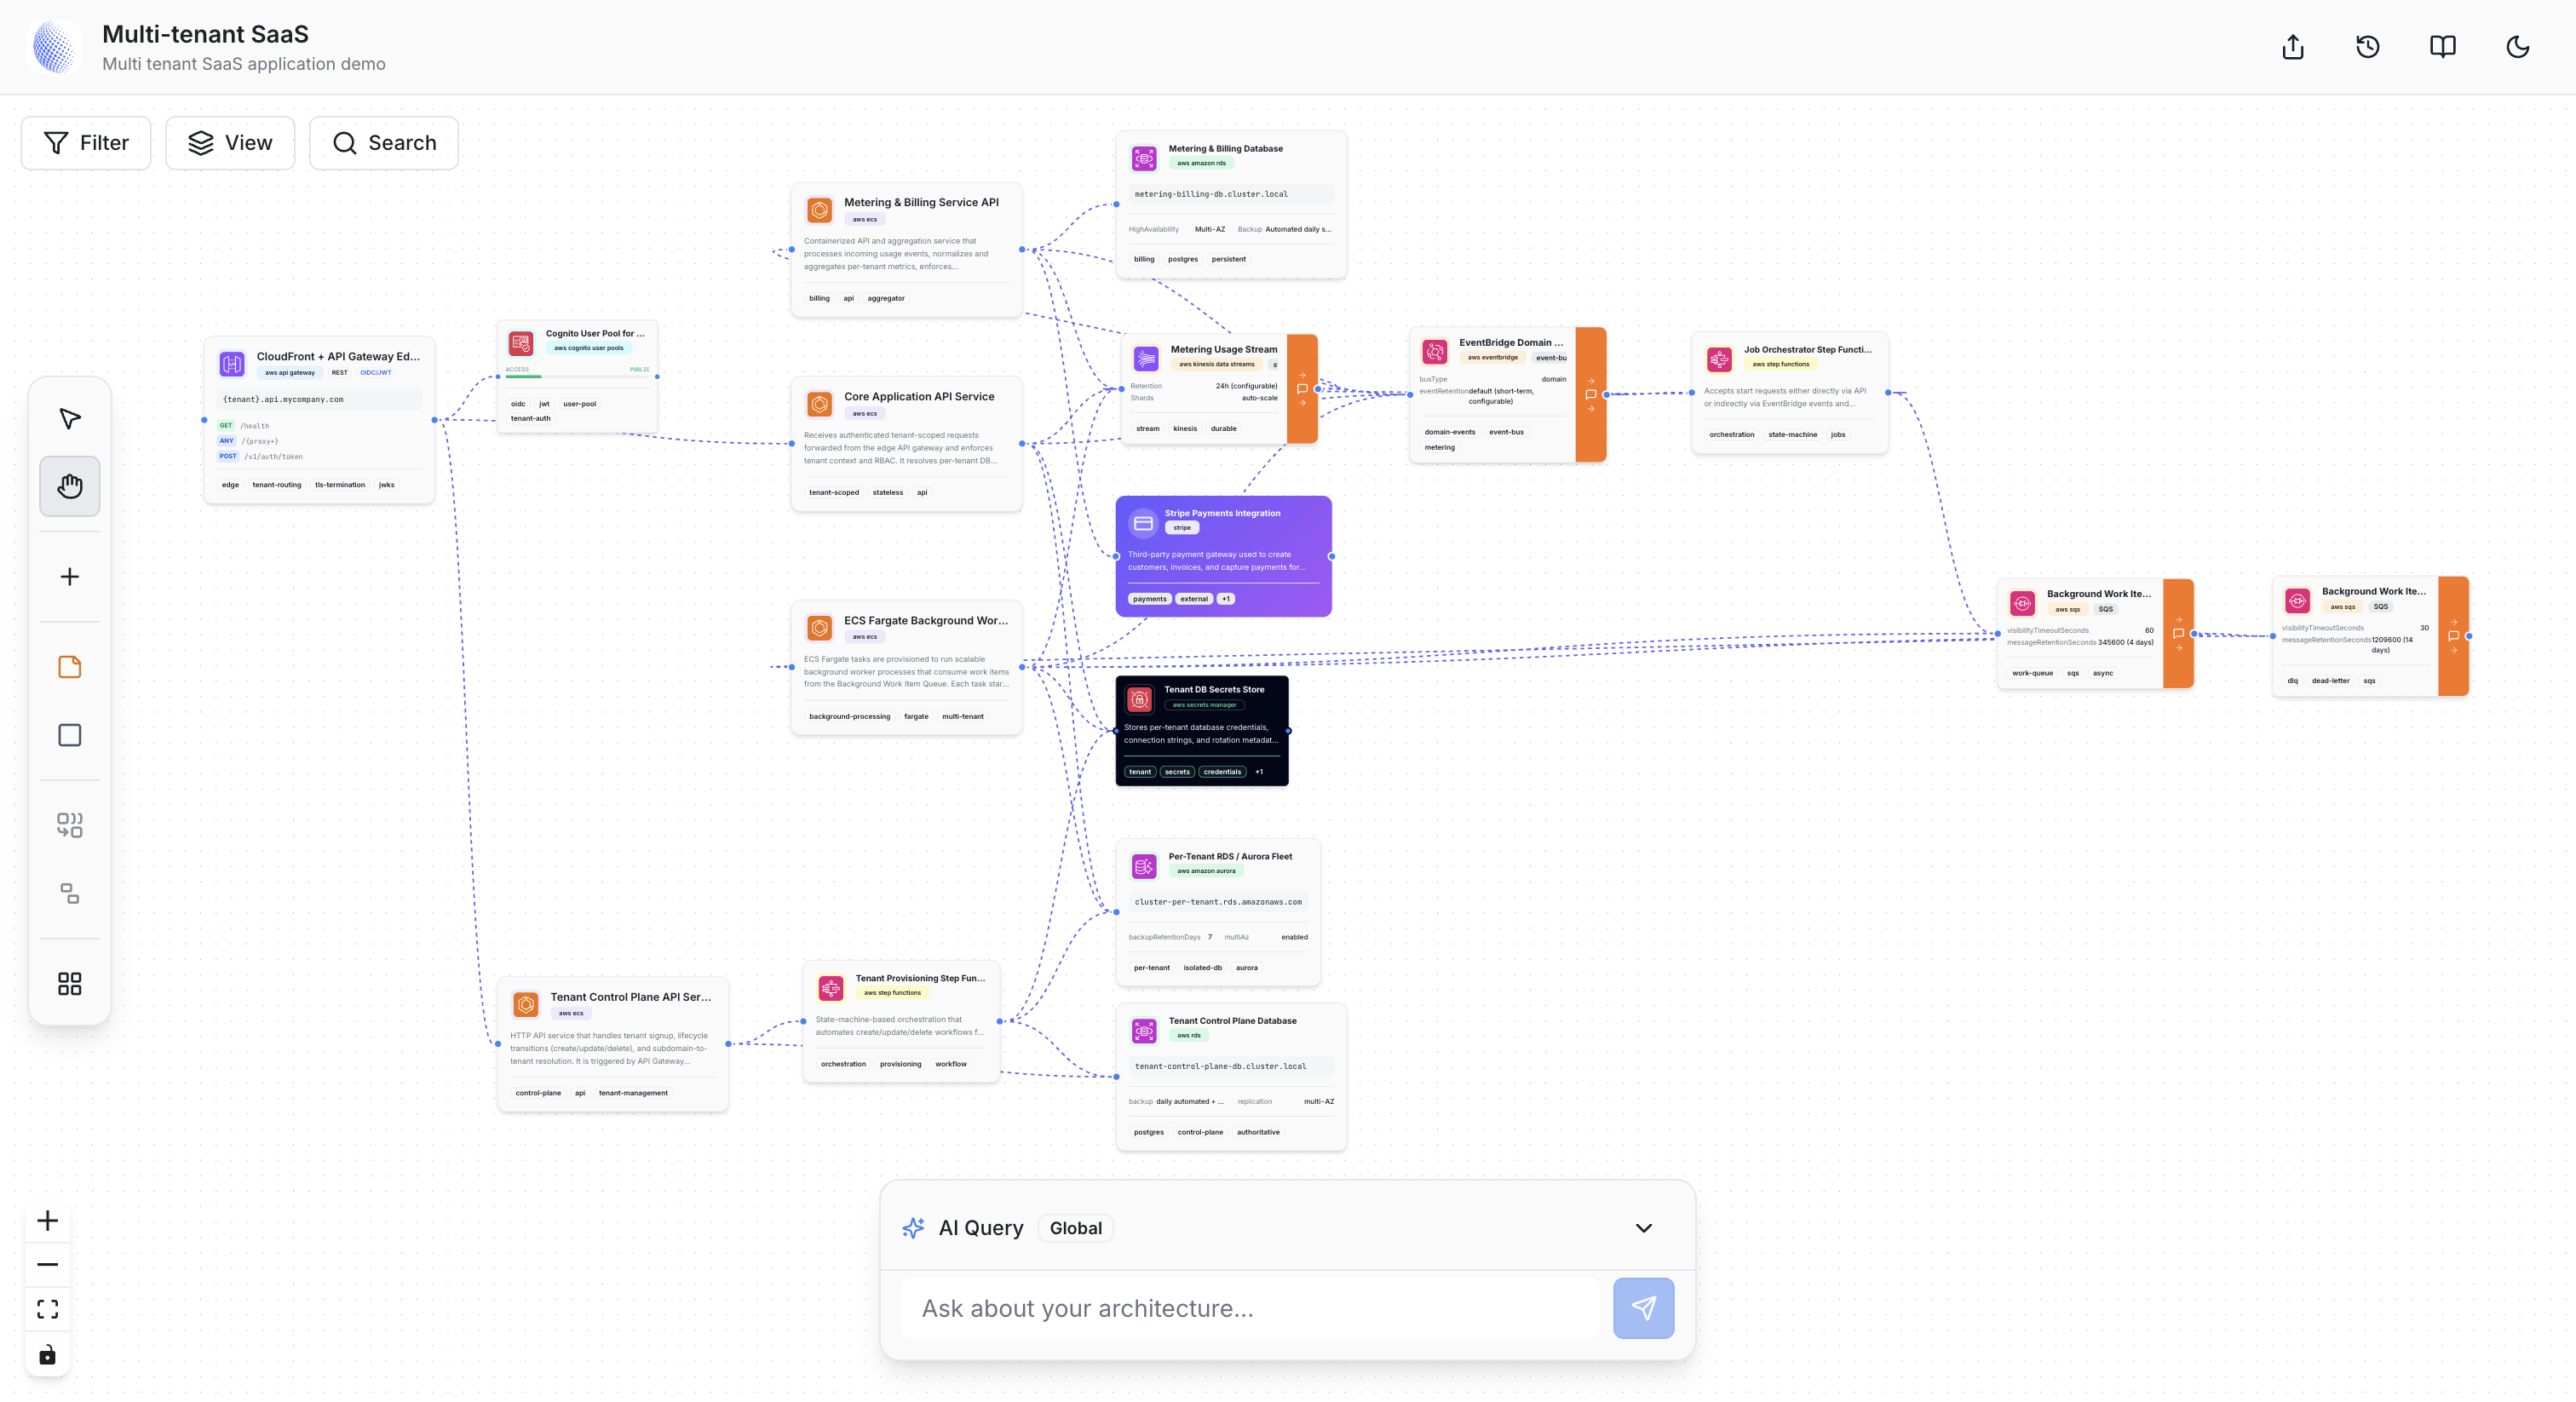
Ecommerce architectures look deceptively simple on a napkin — a storefront, a database, a payment provider — and deceptively complicated the moment you start thinking about flash sales, cart consistency, order fulfillment queues, and recommendation latency under load. Most teams end up with an architecture that evolved rather than one that was designed, documented, and stress-tested before the first line of production code was written. This post walks through what it looks like to do that with Grafica, end-to-end, in five minutes. We'll take a plain-English description of an ecommerce platform on AWS, generate a blueprint, let the agent write the documentation, fill in the real metadata, and then simulate a 20× traffic spike — the kind your checkout service will see the moment a flash sale goes live.
Step 1 — Describe the system in plain English
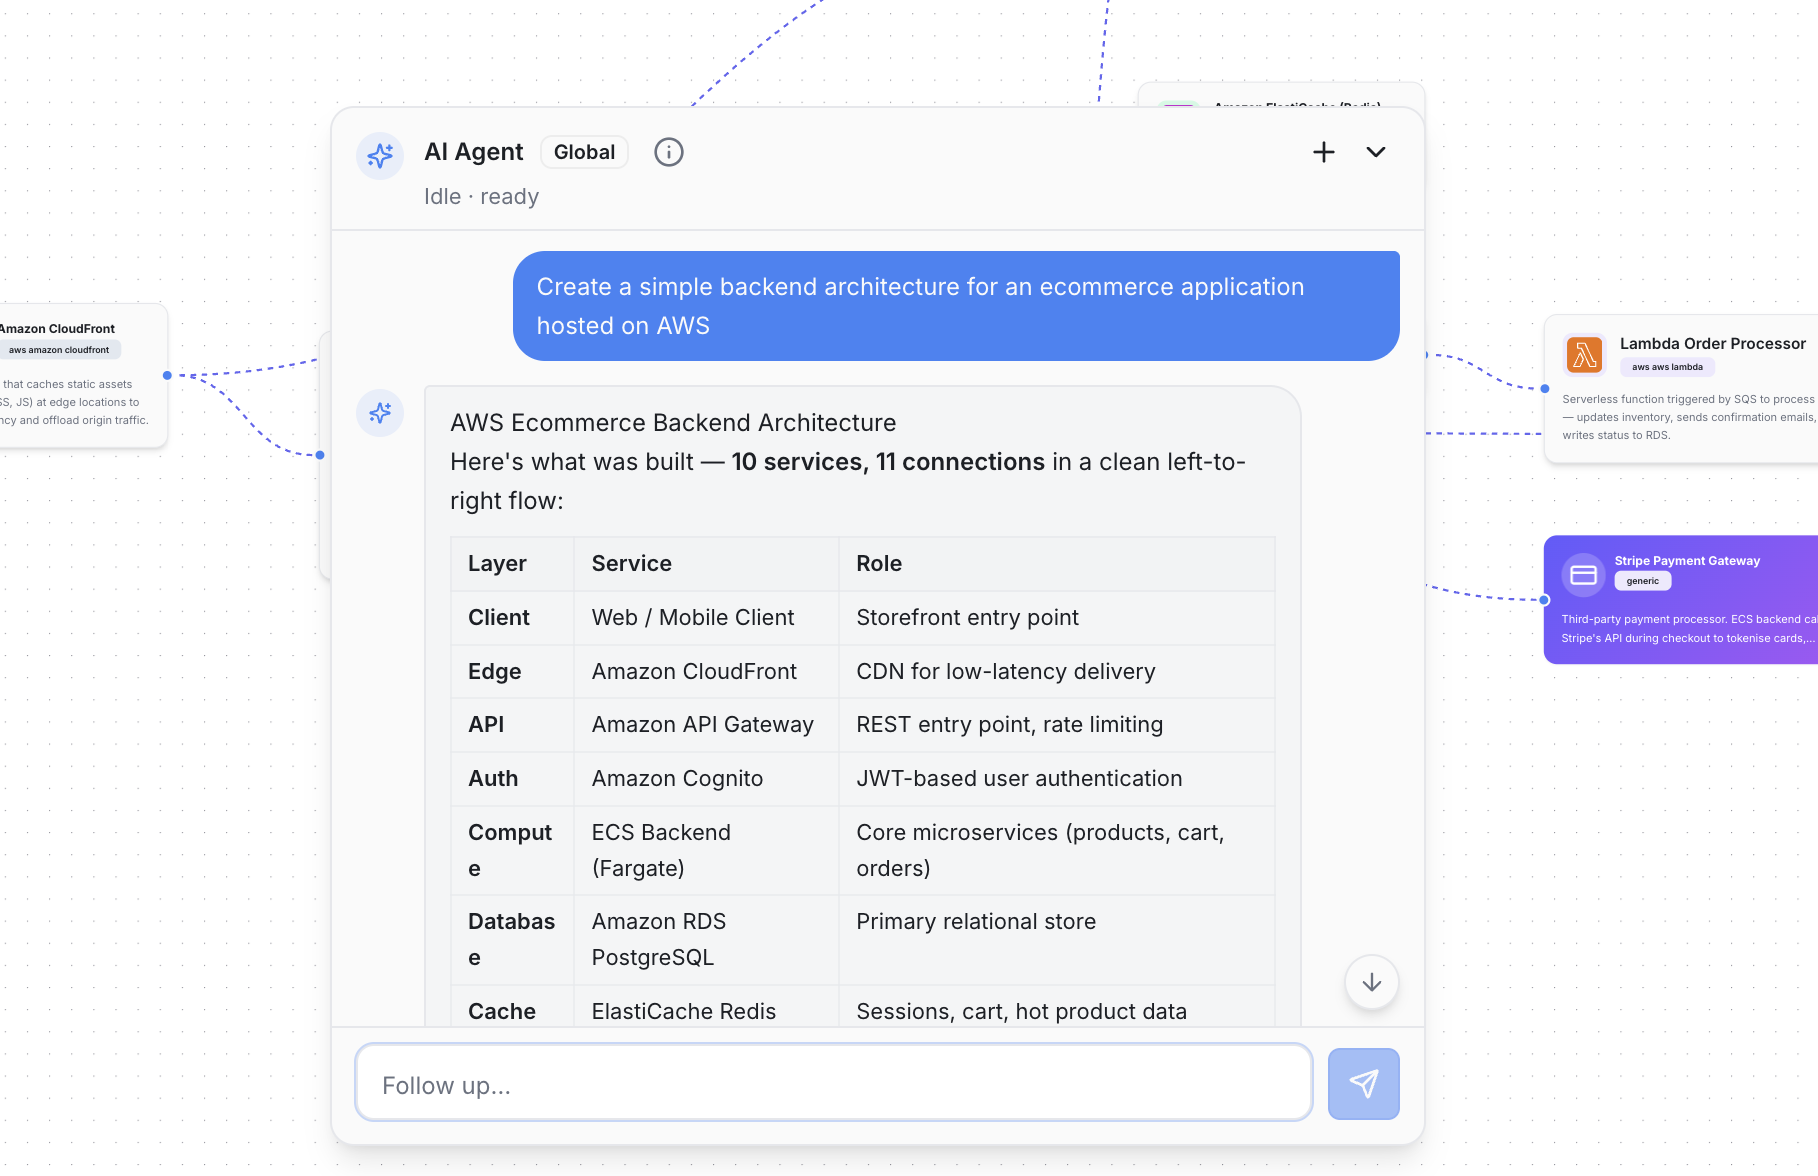
Open a new blueprint and describe what you're building. No schema, no service list — just plain English. For this walkthrough: "I need an ecommerce platform on AWS. Customers browse a product catalog, add items to a cart, check out via Stripe, and receive order confirmation emails. We need a recommendation engine, a fulfilment queue for warehouse notifications, and the whole thing has to survive flash sale traffic spikes." From there, Grafica's agent does the heavy lifting — mapping the prompt to known AWS patterns, sketching the major service boundaries, wiring up the connections, and validating the result for obvious gaps. Within a few seconds you're looking at a real blueprint on the canvas: a CloudFront distribution in front, API Gateway routing to ECS services, RDS for orders, ElastiCache for sessions and cart state, SQS feeding the fulfilment queue, and SES for transactional email. Everything placed, connected, and ready to explore.
Step 2 — Review the initial proposal
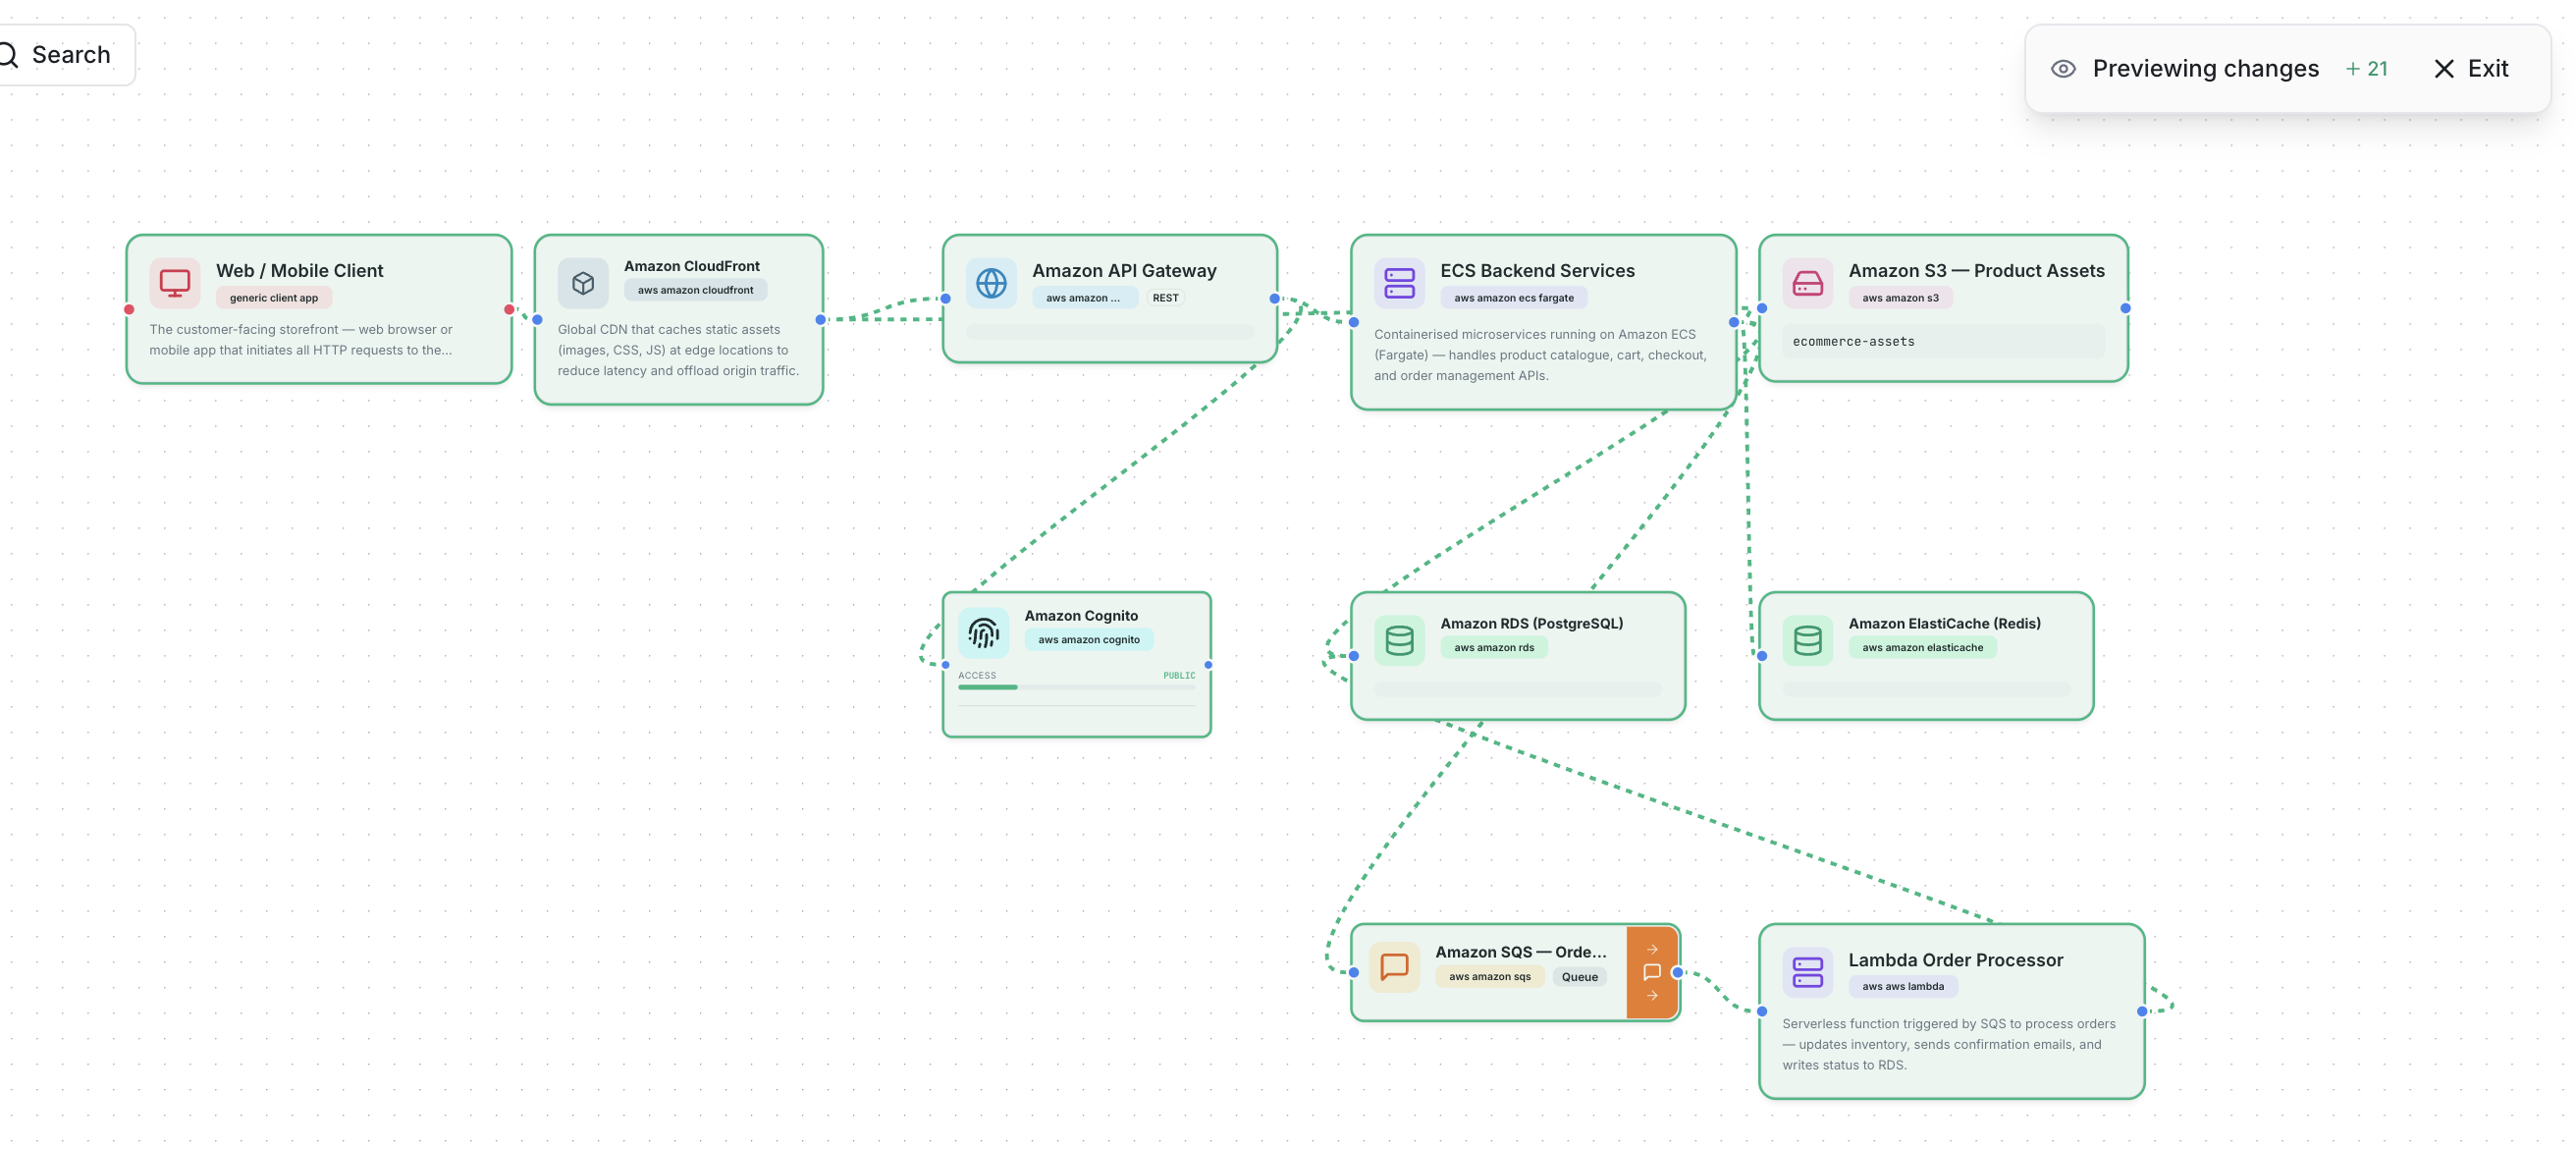
Grafica's agent doesn't just draw boxes — it surfaces a proposal you can actually evaluate. The canvas shows you the full shape of the system: which services are stateless and which carry state, where the external dependencies land, and how the checkout request path threads through the graph. Hover over a connection to see what it carries; click a node to see what the agent inferred about it. This is the moment to challenge the structure before any of it hardens. Is the recommendation engine on the hot path or async? Is there a single database handling both catalog reads and order writes? The proposal makes those decisions visible and easy to change while the cost of changing them is still zero.
Step 3 — Let the agent write the documentation
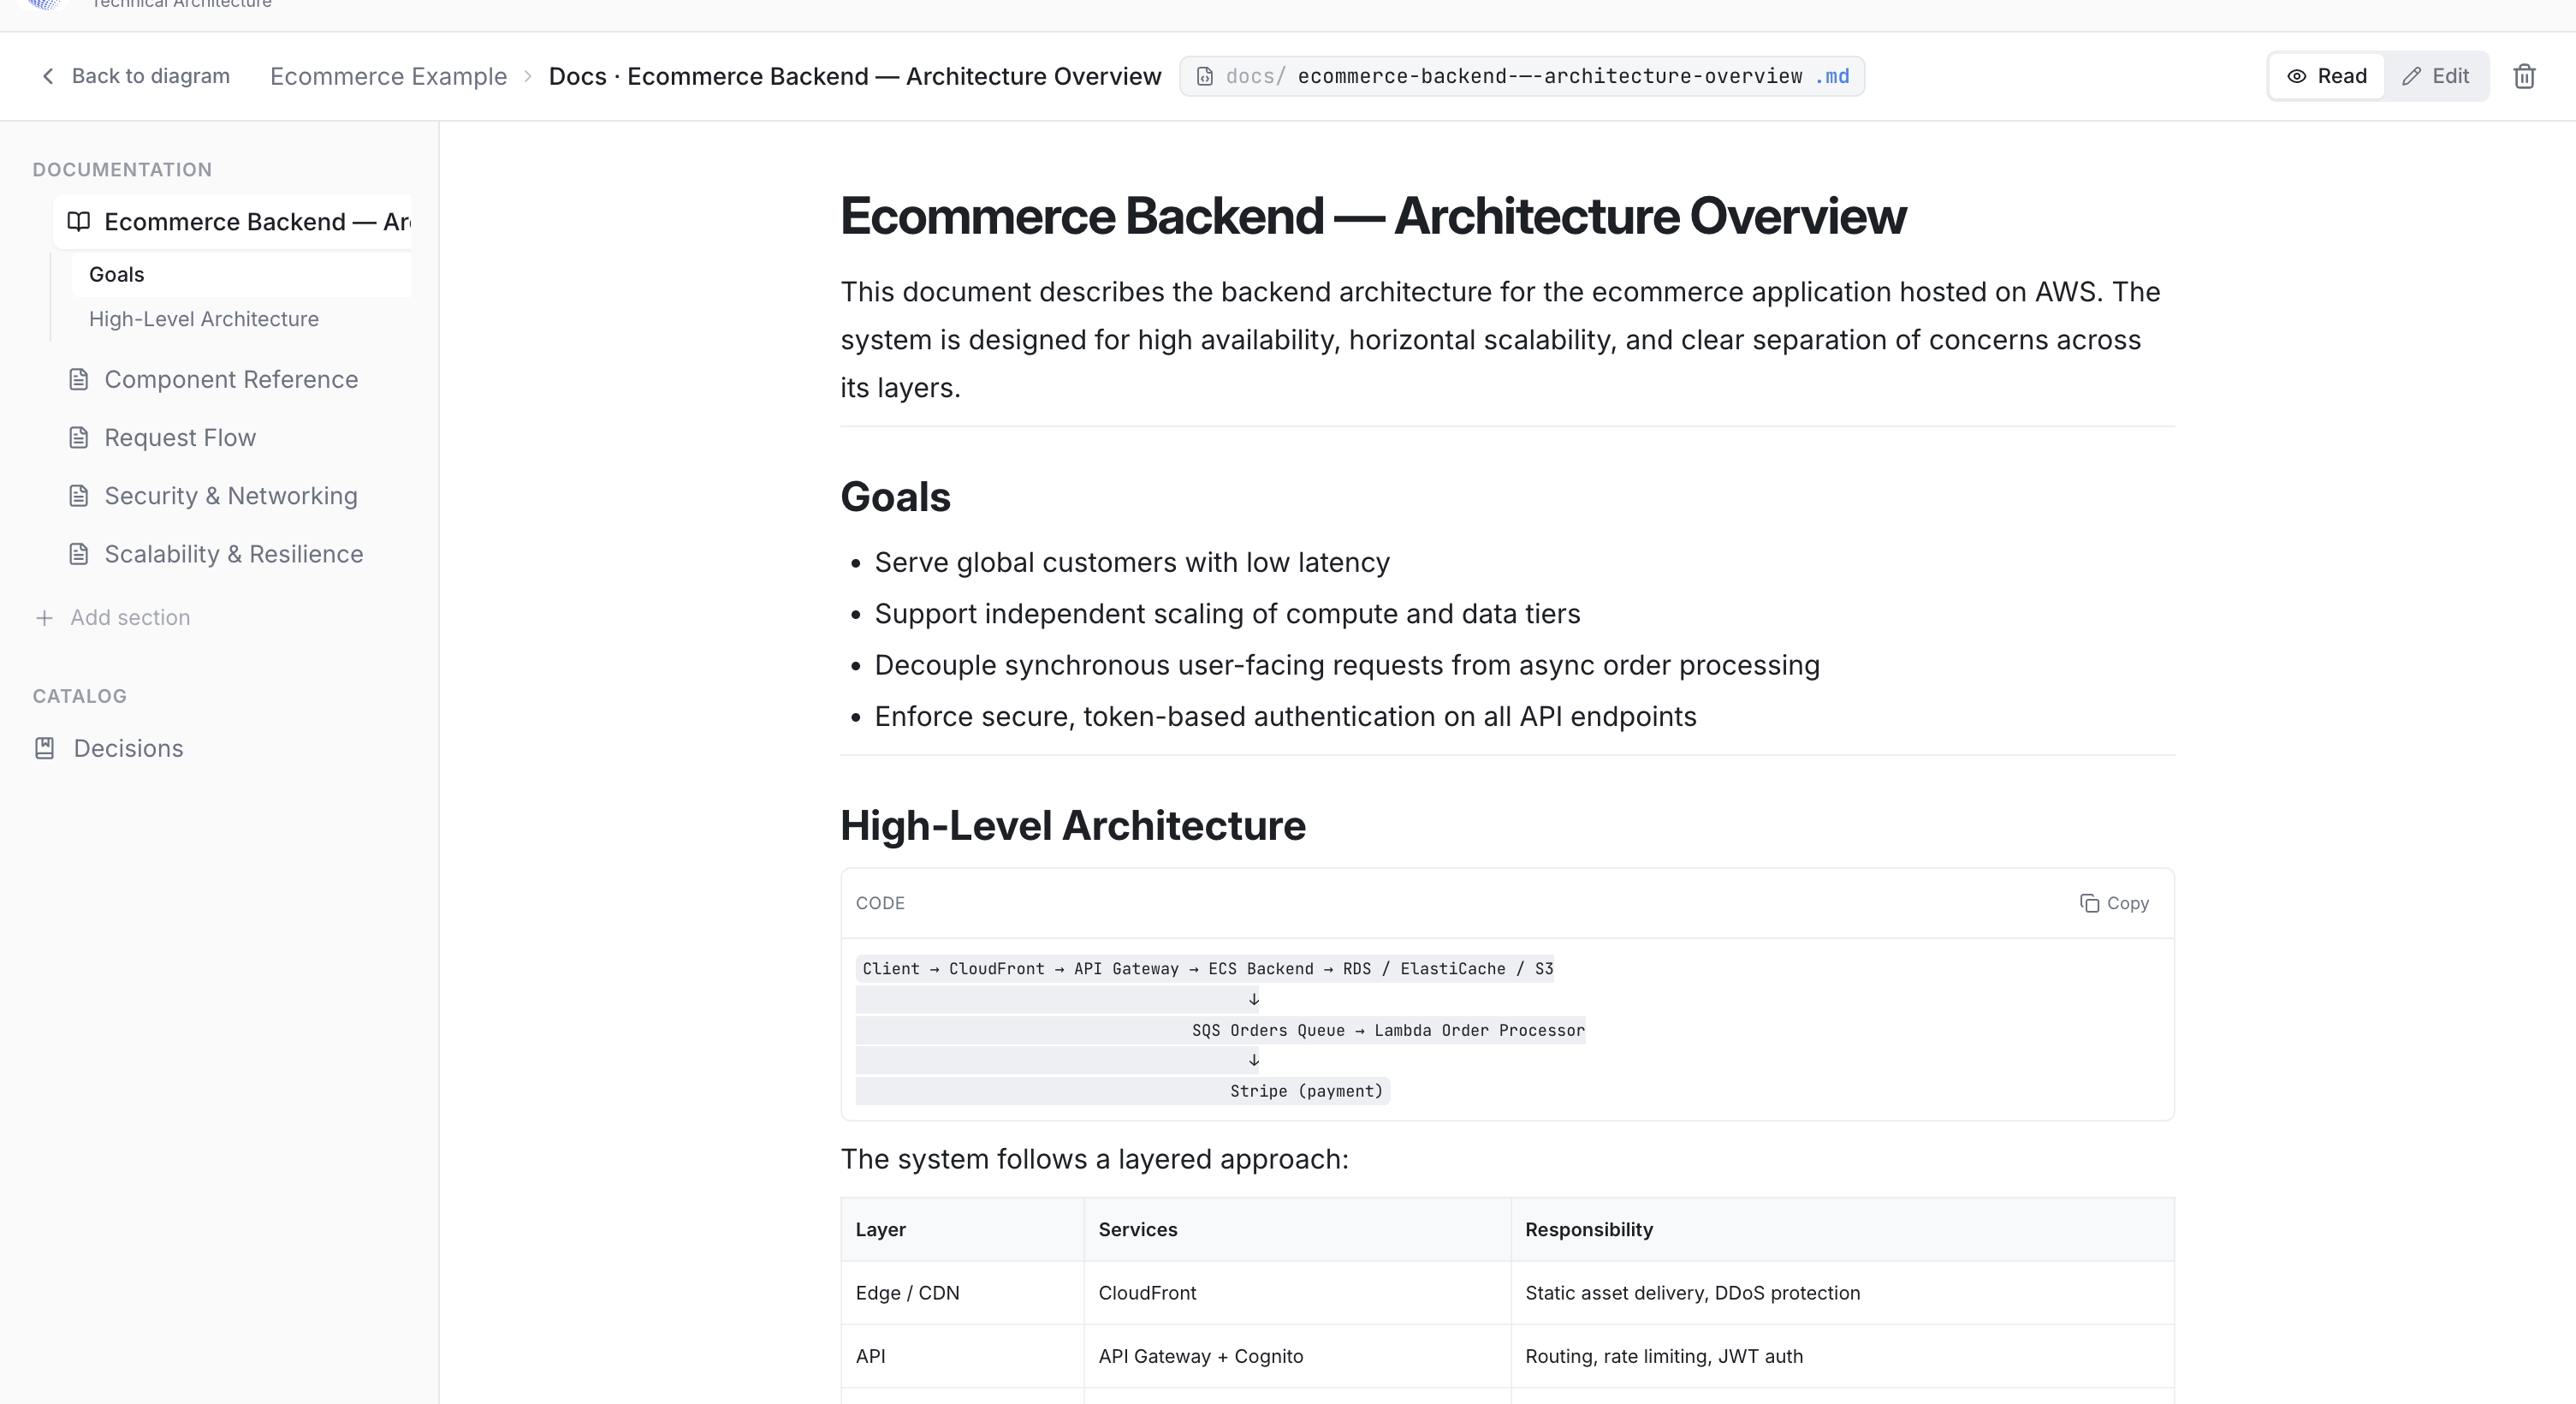
Once you're happy with the structure, tell Grafica to generate the documentation. The agent reads the blueprint as a structured graph — nodes, edges, types, inferred responsibilities — and produces an architecture document grounded in what is actually on the canvas: an overview of the system, a component-by-component breakdown, the data flow from product browse through checkout to fulfilment, and a section on trade-offs worth watching (cart consistency under concurrent writes, ElastiCache TTL choices, the blast radius of an SQS consumer falling behind). The result is a document you can share before the first standup, not the one you write six weeks after the service is in production.
Step 4 — Enrich the metadata drawer
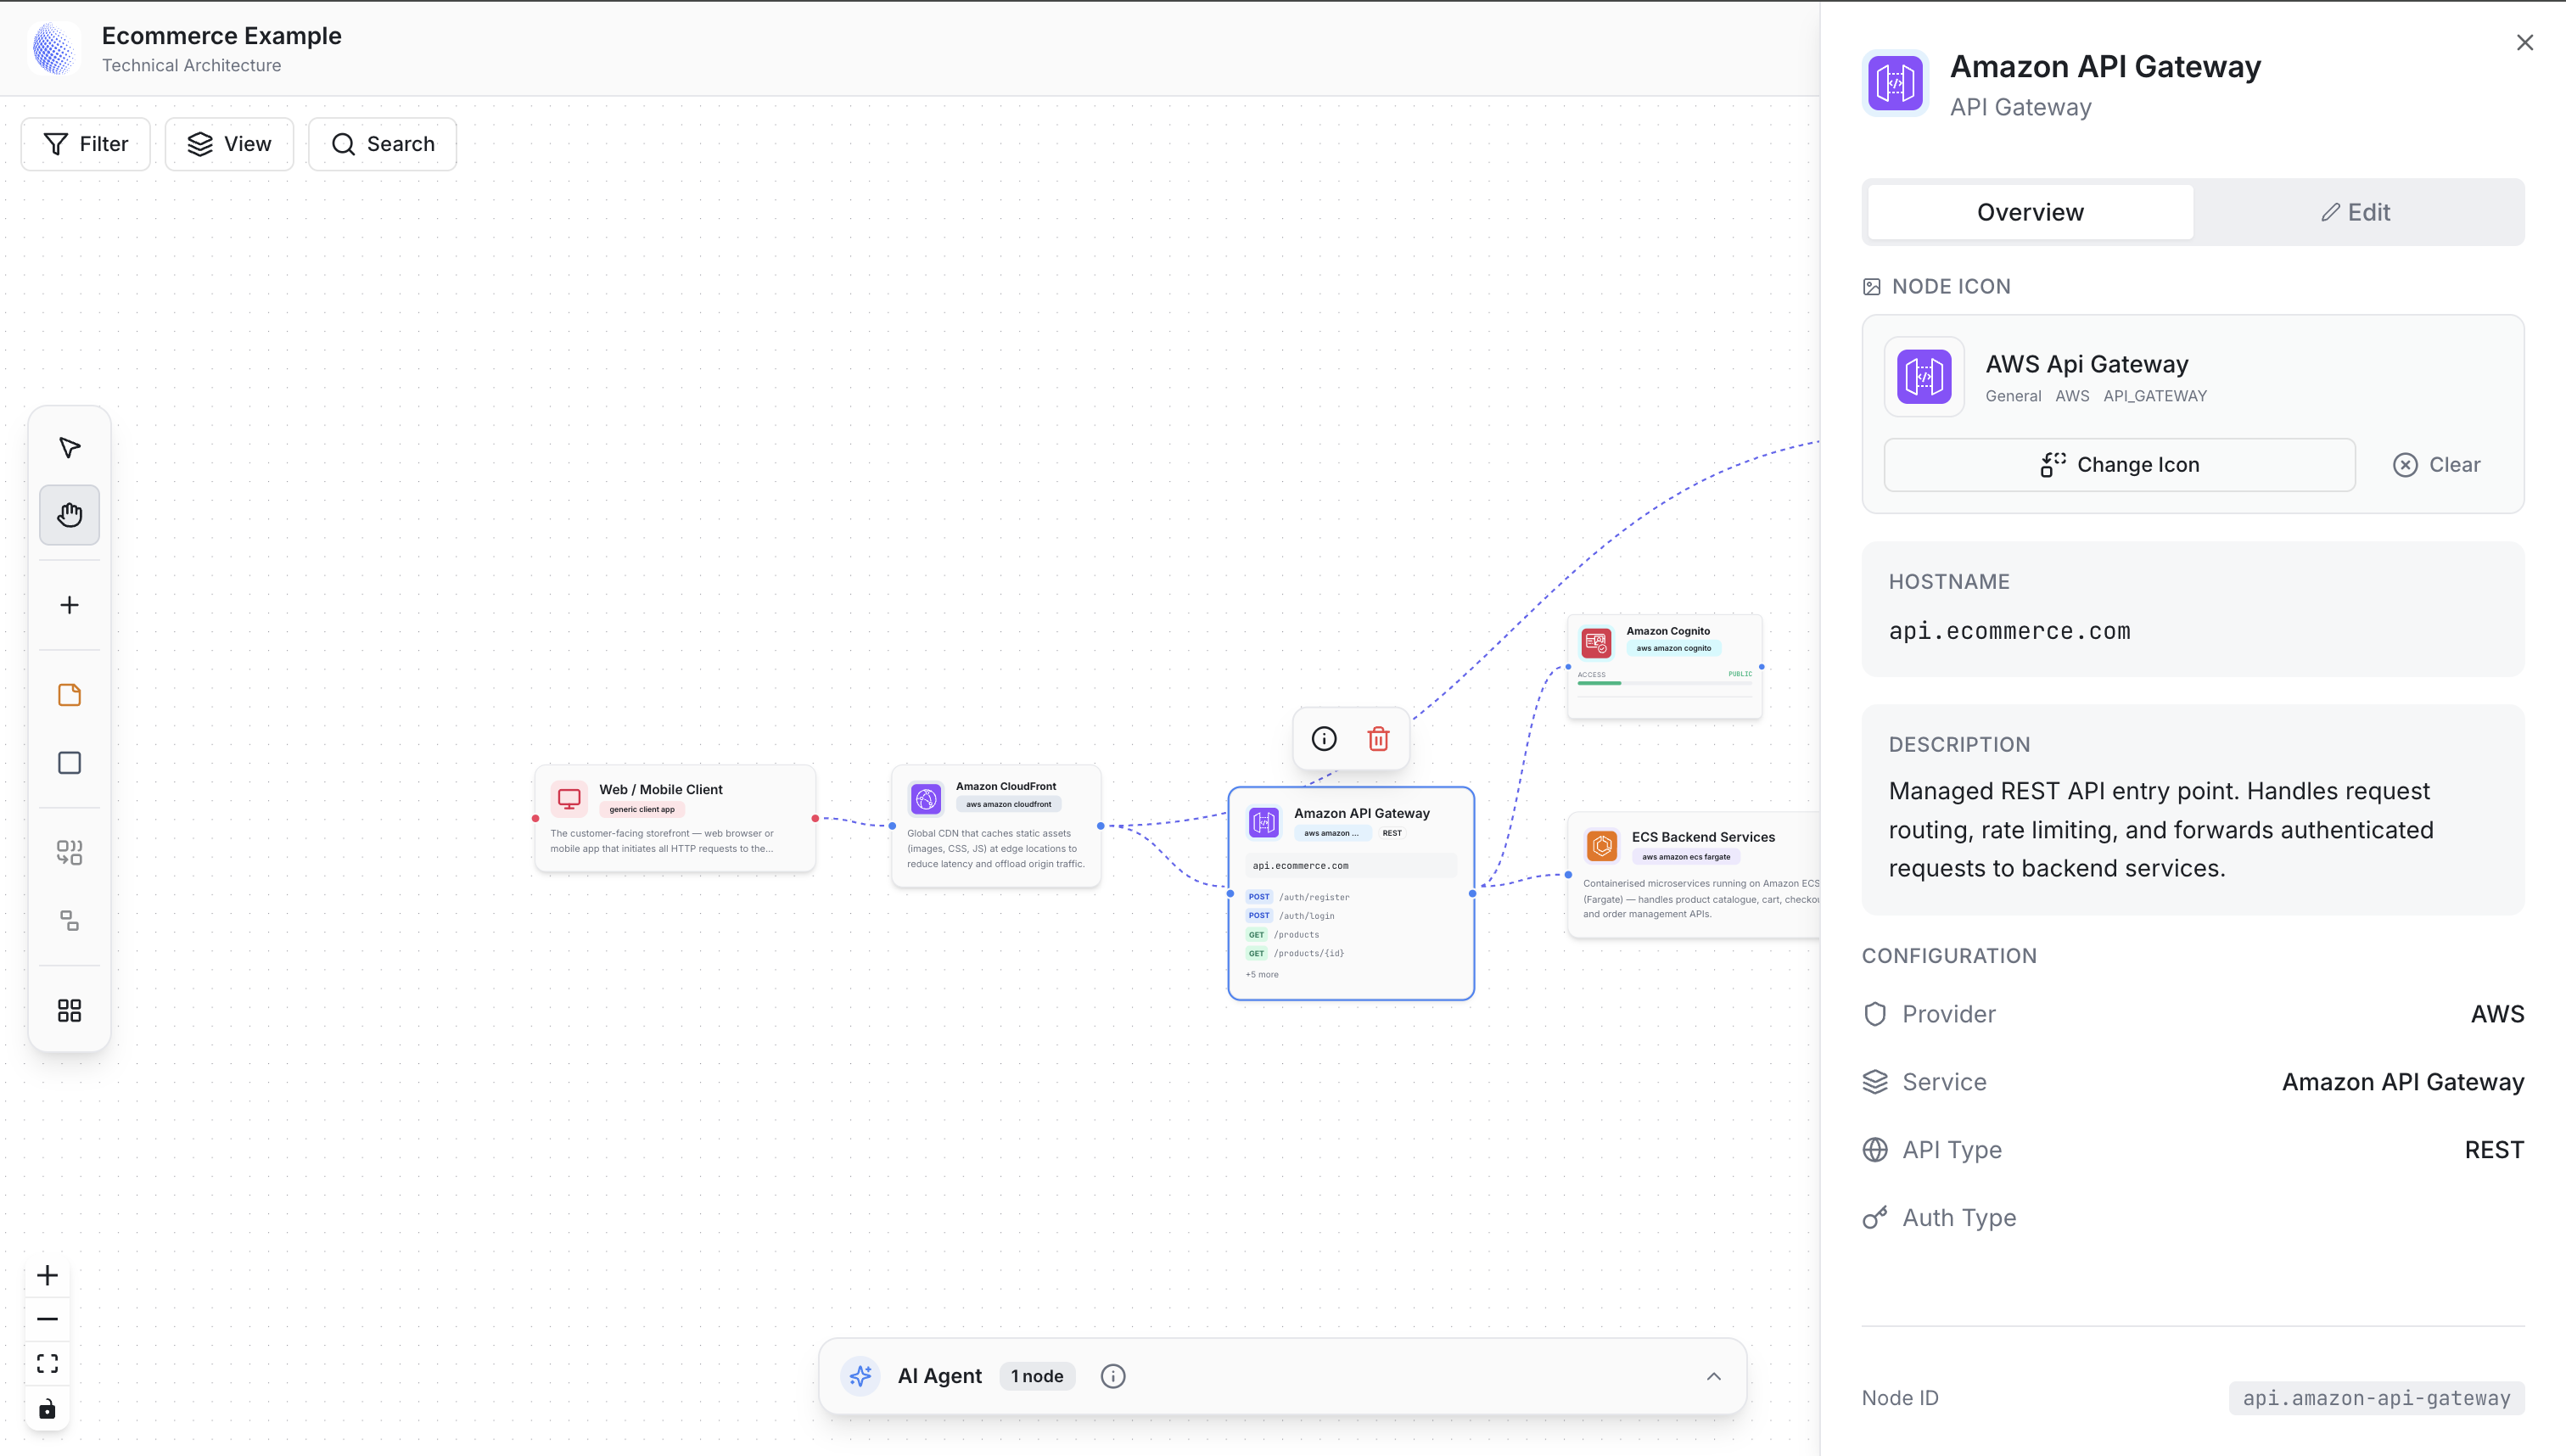
Click any node to open its drawer. This is where the diagram stops being decorative and starts being useful. Every node carries structured fields: AWS region, service type, resource identifiers, environment variables, open ports, and free-form tags.
Step 5 — Simulate a 20× traffic spike
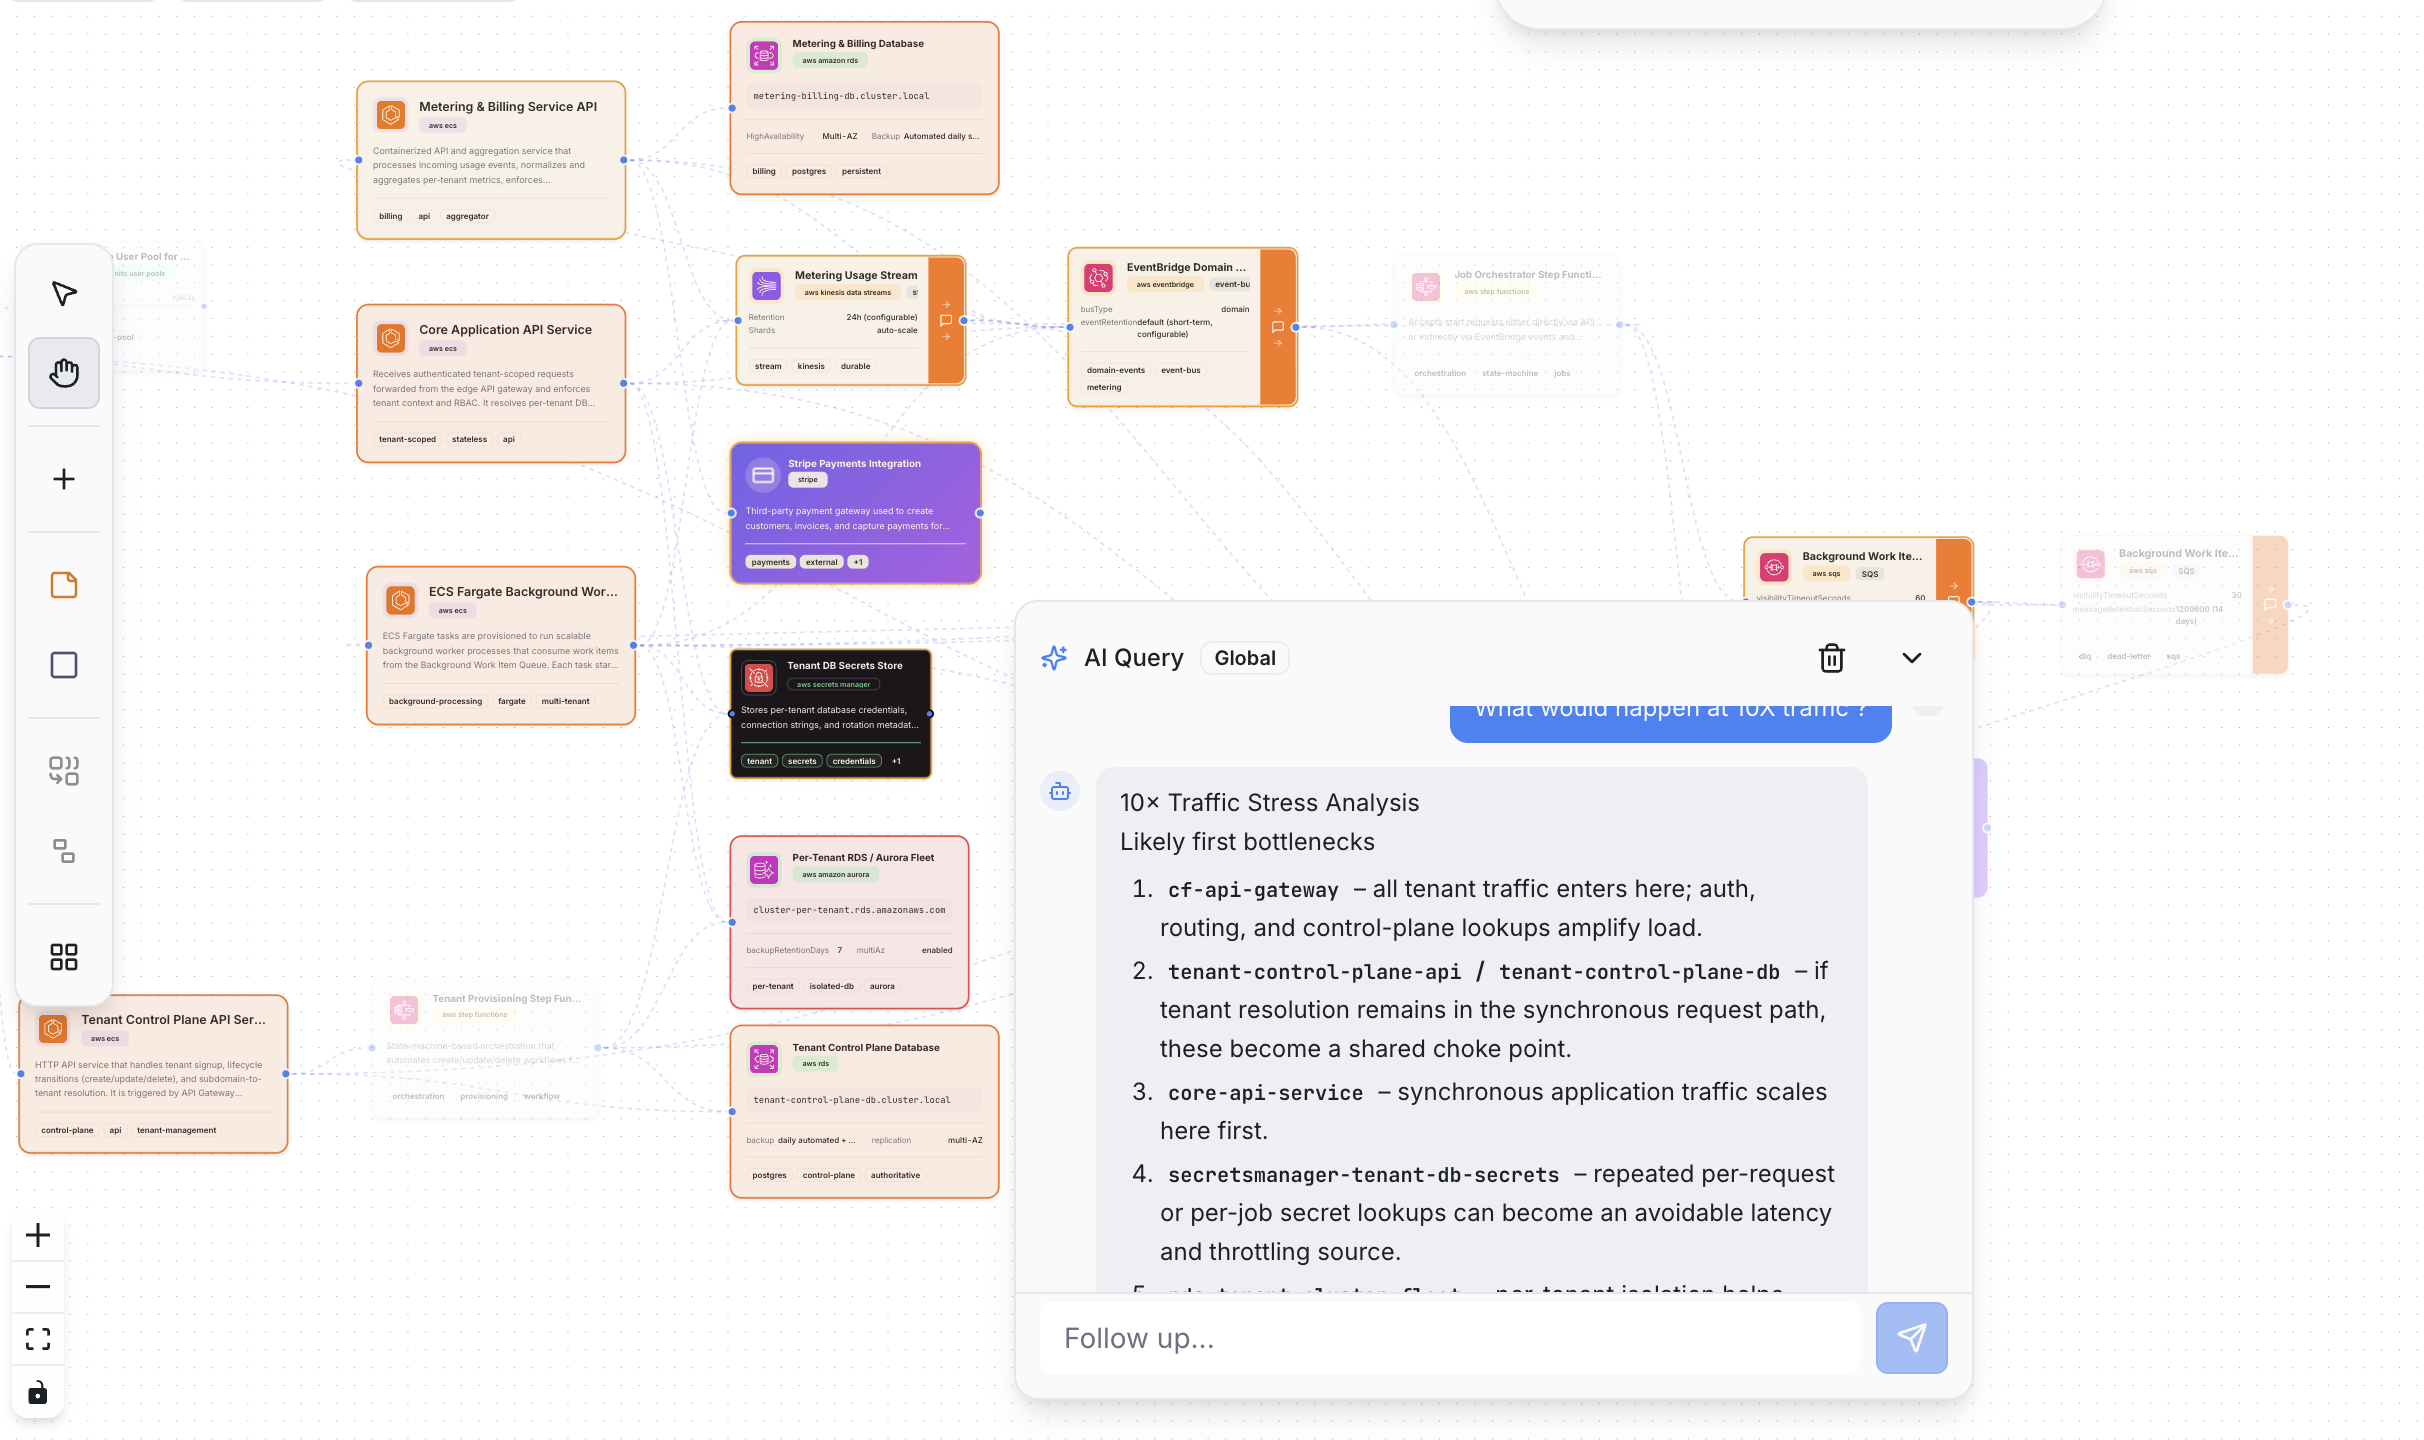
Switch to scenario mode and model the thing you're actually worried about. For an ecommerce platform, that's a flash sale — 20× normal traffic ramping over two minutes. Grafica propagates the load through the architecture graph and shows you where the system starts to crack before any of it reaches production.
Step 6 — Snapshot, share, and version
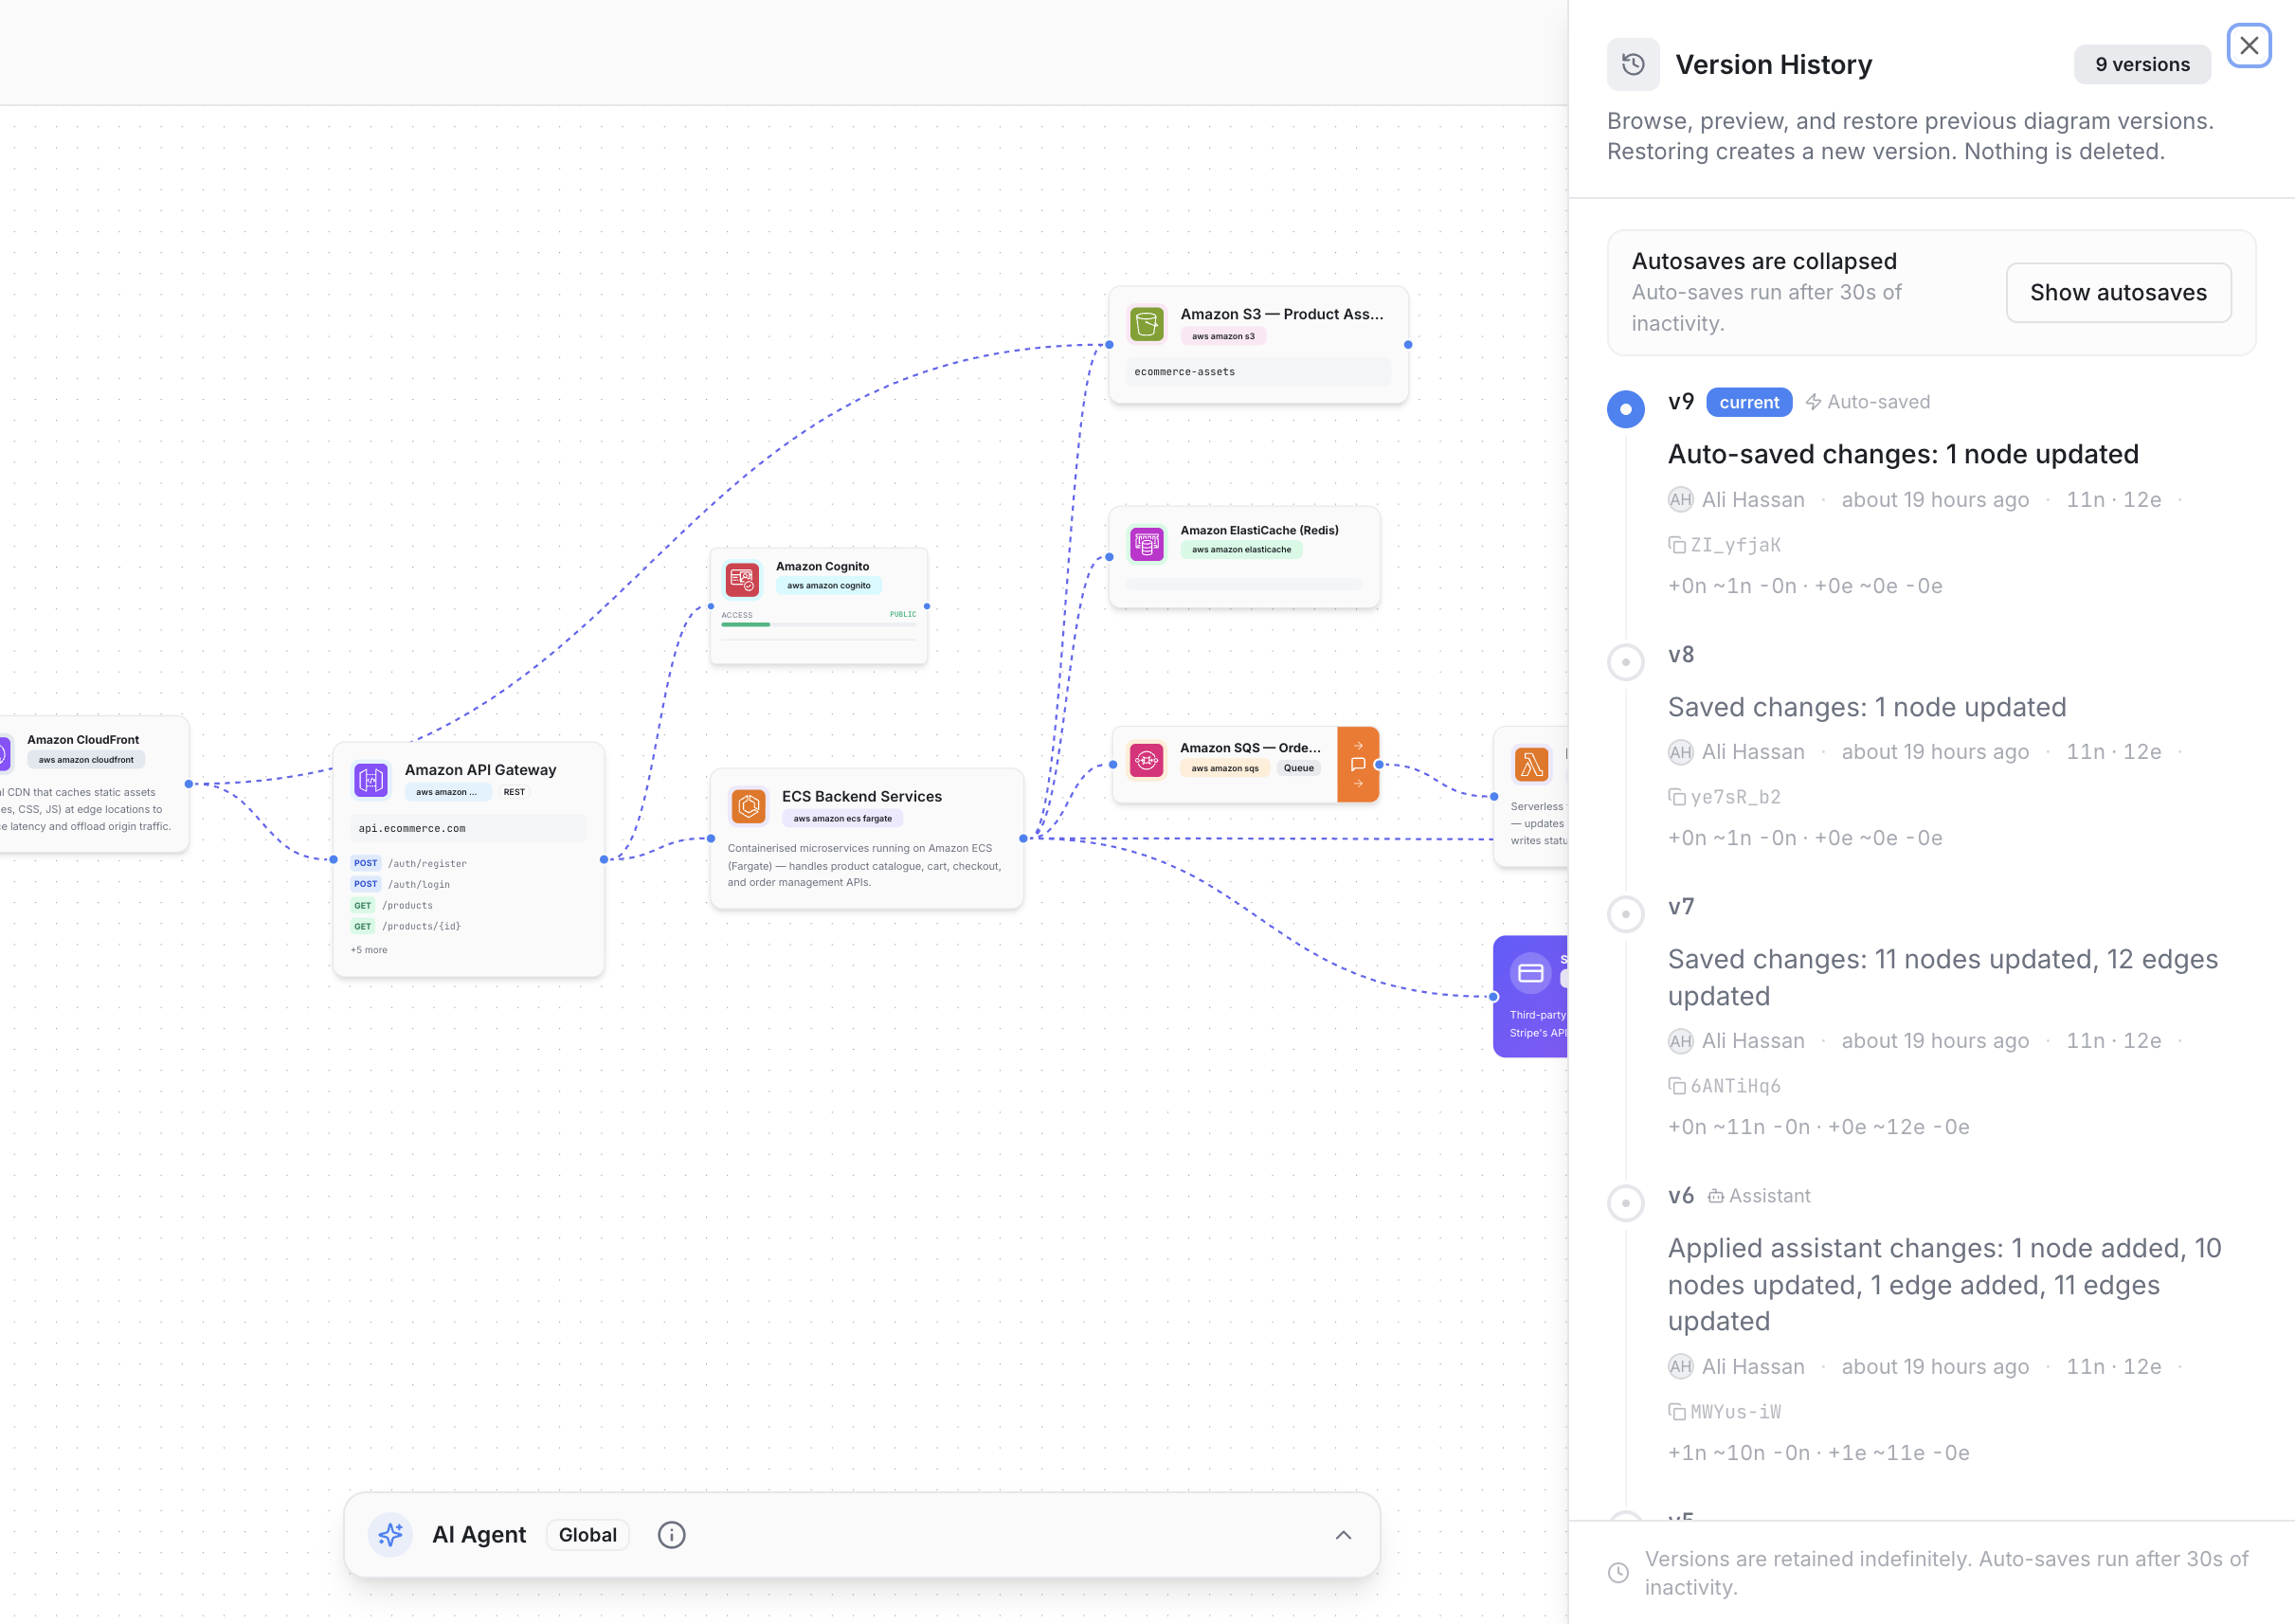
When you're happy, hit Save and Grafica writes a versioned commit of the blueprint. Every commit is a reviewable artifact: who made it, what changed, whether it was AI-proposed or manual, and a preview against the previous version. Once ready, your team can view, edit, comment or start developing the application straight from the blueprint.
Five minutes is genuinely all it takes for an architect who knows what they want. The point of Grafica isn't speed for its own sake — it's that the cost of capturing a thought as a real, queryable, simulate-able diagram has dropped to roughly the cost of writing a Slack message. Once that cost is low enough, you start diagramming things you would never have bothered to before: the migration plan, the failure mode you're worried about, the proposal you don't want to write a doc for yet. The diagram becomes the medium of thought, not the artifact of it. We'd love to hear what you build with it — drop us a note at admin@grafica-ai.com, or jump in and start a free blueprint right now.